Where to live
North vs South Italy: What Changes When You Live There (2026)
By Steven DavisFacts checked October 24, 2026
The short answer
On most official measures, the North scores higher and the South costs less. In mid-2026, 70.6% of people aged 15 to 64 had a job in the North, against 51.1% in the South. Southern households spent €2,215 a month in 2025, against €3,087 in the North-east. The split is not clean: Sicily leads Italy on fiber coverage, and Turin's average rent is below Naples'.
- Household spending (ISTAT, 2025)
- €3,087 a month in the North-east; €2,215 in the South
- Employment rate, ages 15 to 64 (ISTAT, Q2 2026)
- 70.6% North, 67.7% Centre, 51.1% South and Islands
- Average asking rent (idealista, Q3 2026)
- €18.9 per m² a month in Lombardy; €6.9 in Calabria
- Public healthcare scores (2024 data, of 300; Sky TG24 sum of Ministry scores)
- Veneto 288 highest, Calabria 189 lowest
- Public transport in provincial capitals (ISTAT, 2024)
- 5,979 seat-km per resident in the North; 2,240 in the South
- Fiber to the home (AGCOM, end of 2025)
- Sicily highest at 89% of households; Valle d'Aosta lowest at 59%
- 7% flat tax for foreign pensioners
- Towns of up to 30,000 residents in 8 southern regions and some central earthquake areas
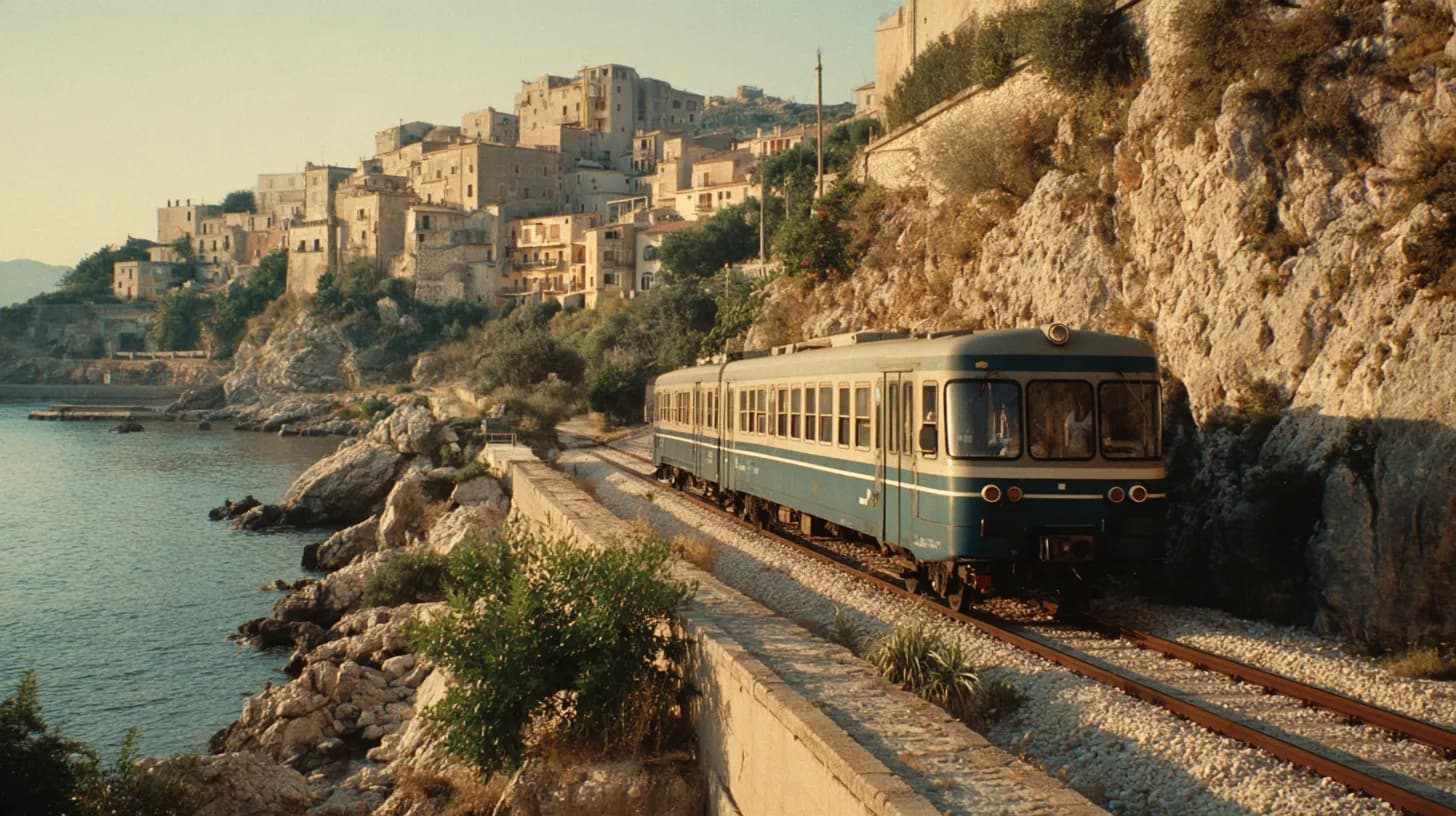
What "north" and "south" mean in the data
In the reports used here, ISTAT (the Italian National Institute of Statistics) groups regions into 5 areas: North-west, North-east, Centre, South and Islands. Several also use Mezzogiorno (the South, including Sicily and Sardinia) for the last 2 combined.
This guide uses those official areas and compares them on dated, published data. Each section also shows where a region or city breaks from its area's average, because that is often what decides a move.
| Measure | Centre-North | South and Islands | What the average hides |
|---|---|---|---|
| Household spending, 2025 (ISTAT) | €2,974 to €3,087 a month | €2,215 South, €2,338 Islands | Trentino-Alto Adige €3,444, Puglia €1,975 |
| Employment rate, ages 15 to 64, Q2 2026 (ISTAT) | 70.6% North, 67.7% Centre | 51.1% | Women: 63.9% North, 38.7% South |
| Average asking rent, Q3 2026 (idealista) | €18.9 per m² Lombardy, €20.0 Tuscany | €6.9 Calabria, €6.3 Molise | Sardinia €14.7, above Veneto €12.0 |
| Public transport, 2024 (ISTAT, seat-km per resident) | 5,979 North, 5,263 Centre | 2,240 | Milan 16,374 |
| Healthcare score, 2024 data (of 300, Sky TG24 sum of Ministry scores) | Veneto 288, the highest | Calabria 189, the lowest | Puglia 242, above Lazio 237 and Bolzano 206 |
| Fiber to the home, end of 2025 (AGCOM) | Trentino-Alto Adige 87%, Valle d'Aosta 59% | Sicily 89%, Calabria 65% | No north-south pattern; national 77.6% |
| Quality of life, 2025 (Il Sole 24 Ore) | Top 10 provinces all northern | Last 22 all southern | Cagliari 39th, ahead of Turin 57th |
How living costs compare
Households in the South spent €2,215 a month on average in 2025, according to ISTAT. In the North-east the figure was €3,087. By region, spending ranged from €3,444 in Trentino-Alto Adige to €1,975 in Puglia.
Spending tracks income as well as prices. ISTAT notes that households in the South and Islands generally have less money available.
A more direct price signal is ISTAT's absolute poverty threshold. It is the monthly cost of a basket of essential goods and services, and it varies by region and town size. For one adult aged 30 to 59, the 2025 threshold was €1,256.37 in a Lombardy metropolitan city. In a small town in Puglia it was €728.87.
% of households
Households spending at or below one national line (€1,231.01 a month for 2 people in 2025). ISTAT's absolute measure, which adjusts for regional costs, puts the South at 9.6% and the Centre-North at 6.3% to 7.7%.
Source: ISTAT, La povertà in Italia, 2025 data (published October 15, 2026)
The two poverty measures tell different stories. Relative poverty compares every household with one national spending line, whatever local prices are. On that measure, 19.5% of southern households were poor in 2025, against 5.9% to 7.8% elsewhere.
Absolute poverty, which counts local costs, narrows the gap. It was 9.6% in the South and Islands, against 6.3% to 7.7% in the other areas. ISTAT describes the relative measure as tied to inequality in spending, not to a fixed basket of goods.
For budgets by city, see the cost of living guide.
How rents compare
Rent varies far more than overall spending. In Q3 2026 data from the property portal idealista, average asking rents reached €25.6 per m² a month in Valle d'Aosta, €20.0 in Tuscany and €18.9 in Lombardy. They were €6.9 in Calabria, €6.6 in Basilicata and €6.3 in Molise.
The regional line has exceptions. Sardinia averaged €14.7 per m², above Veneto (€12.0), Friuli-Venezia Giulia (€10.6) and Piedmont (€10.3). Campania, at €10.1, sits close to Piedmont.
City by city, the picture shifts again. Milan averages €22.4 per m² and Palermo €9.5, but Turin (€13.5) is cheaper than Naples (€14.7). idealista's figures are asking rents on its own listings and exclude holiday and seasonal rentals.
Jobs and wages
The employment gap is large. In the second quarter of 2026, ISTAT put the employment rate for ages 15 to 64 at 70.6% in the North. It was 67.7% in the Centre and 51.1% in the South and Islands.
The gap is widest for women: 63.9% were employed in the North and 38.7% in the South. Unemployment was 3.7% in the North, 5.3% in the Centre and 10.4% in the South.
The South is moving faster from a lower base. Its employment rate rose 0.9 points in a year, against 0.7 in the North, and its unemployment rate fell 1.8 points.
Pay follows the same map. INPS (the national social security institute) put average annual pay for private-sector employees at €24,486 in 2024. The North-west averaged €28,852 and the North-east €25,723.
What this means for you depends on where your income comes from. A US pension or a remote job is not affected by local hiring. If you need an Italian employer, the northern job market is larger.
Healthcare quality by region
The Ministry of Health scores each region's public health service every year. The Nuovo Sistema di Garanzia (NSG, the national monitoring system) rates prevention, community care and hospital care from 0 to 100. A score of 60 is the pass mark.
In the 2024 results, published July 10, 2026, only 3 fell below 60 in any area. Sicily and the autonomous province of Bolzano fell short on prevention, and Calabria on community care. The Ministry notes that community care scores remain lower in the Centre and South.
The news channel Sky TG24 added up the 3 scores from the Ministry's data. Veneto led with 288 of 300, and Calabria was last with 189. Puglia (242) scored above Lazio (237), Valle d'Aosta (213) and Bolzano (206).
Some patients travel for care. In 2024, 8.6% of acute inpatient stays took place outside the patient's home region, according to the Ministry's hospital discharge report. The Ministry reads a high outflow as a possible sign of gaps in local services. It also warns that people near regional borders cross them for convenience.
These are regional averages for the public system. They do not rate a specific hospital. For enrollment and coverage, see healthcare in Italy.
Public transport and high-speed rail
Local public transport is much thinner in the South. ISTAT measures supply in posti-km (seat-kilometers: seats offered multiplied by kilometers run) per resident of provincial capitals.
In 2024, northern capitals offered 5,979 seat-km per resident, central ones 5,263 and southern ones 2,240. Milan led every city at 16,374. Use followed supply: 237.9 passengers per resident in the North and 56.6 in the South.
The gap is closing slowly. Southern supply grew 13.2% over 2 years, while it fell slightly in the Centre and North.
Italy's fastest lines are concentrated too. RFI (Rete Ferroviaria Italiana, the national rail network operator) lists 1,096 km of AV/AC (high-speed, high-capacity) line as of June 30, 2026. RFI counts lines built for 250 km/h or more, plus high-performance lines above 200 km/h.
In the South, only Campania has AV/AC lines, with 128 km. RFI's pages for Abruzzo, Molise, Puglia, Basilicata, Calabria, Sicily and Sardinia list none. In the North, Emilia-Romagna has 255 km and Lombardy 143 km, while Liguria has none.
Two island networks stand out. All 427 km of RFI line in Sardinia is non-electrified, and 1,106 of Sicily's 1,370 km are single-track. See trains in Italy for how service works in practice.
Climate and air quality
The South is warmer. ISTAT's 1981 to 2010 averages put the annual mean at 18.9°C in Palermo and 17.2°C in Bari. Milan averaged 14.5°C and Turin 13.9°C.
Comfort is a different question. The business daily Il Sole 24 Ore ranks provincial capitals on 15 weather indicators in its climate index, published March 9, 2026. Bari came 1st, and Trieste (8th) and Venice (15th) also made the top 40.
Carbonia, in southern Sardinia, came last, just behind Terni, Belluno and Caserta. It is among the capitals hit hardest by extreme heat peaks, heat index and humidity.
Air quality favors the South on fine particles. In the 2022 to 2024 average, more than 95% of northern provincial capitals exceeded the World Health Organization's PM2.5 limit, against about 70% in the South.
Nitrogen dioxide, mostly from traffic and heating, does not split by area. Among the largest cities in 2024, Turin, Genoa, Rome, Naples, Palermo and Catania exceeded its legal limit. Milan fell just below it.
Internet and fiber
Fiber coverage does not follow the north-south line. AGCOM (Italy's communications regulator) reports that fiber to the home reached 77.6% of households at the end of 2025.
The best-covered regions were Sicily (89%), Trentino-Alto Adige (87%) and Molise (86%). The least covered were Valle d'Aosta (59%), Calabria (65%) and Liguria (66%).
Regional coverage says nothing about one building. Check the exact address on AGCOM's Broadband Map before you sign a lease. Under Law 50 of April 20, 2026, providers must tell you what reaches your address, based on the map, before you sign. See internet in Italy.
Quality-of-life rankings
Il Sole 24 Ore ranks all 107 provinces each year on 90 indicators. In its 2025 edition, published December 1, 2025, the top 10 were all northern and the last 22 all southern. Reggio Calabria came last for the second year running.
Rankings overlap more in the middle. Cagliari, the highest southern province at 39th, finished ahead of Genoa (43rd) and Turin (57th). Bari placed 67th, Palermo 97th and Naples 104th.
The newspaper's own report credits the South with strengths in demographics, climate and a much lower cost of living. The best places to live in Italy guide compares individual cities, including flights to the US.
The 7% flat tax is tied to southern towns
One tax rule depends directly on where you live. Retirees with pension income from abroad can opt for a 7% flat tax on all their foreign income. They must move their residence to a town of up to 30,000 residents.
The town must be in Sicily, Calabria, Sardinia, Campania, Basilicata, Abruzzo, Molise or Puglia, or in listed earthquake-area towns in central Italy. You must not have been tax resident in Italy in the previous 5 years.
The option covers the year it takes effect and the next 9 tax years. The rule is Article 24-ter of the income tax code, which moves to Article 247 of a new code on January 1, 2027. See the 7% flat tax guide.
Common problems and fixes
Choosing by regional averages. A regional figure can hide the city you want: Turin's average rent is below Naples', and Sicily leads on fiber. Fix: compare the specific province, city and address on the sources linked above.
Planning to live without a car. Movers report that transit and rail links shape their shortlist. Southern capitals offer less than half the northern level of transit. Fix: pick a city with frequent service and a main-line station, or budget for a car.
Picking a 7% town far from a hospital. Retirees weighing the 7% towns ask about hospital access and the quality of care. The law caps eligible towns at 30,000 residents. Fix: check your region's NSG results and the drive to the nearest hospital before you sign a lease.
Assuming you qualify for the 7% tax. Newcomers' questions show confusion over who qualifies, from whether a pension is required to which towns count. The law requires pension income from foreign payers and sets the regions and population cap. Fix: confirm both with a tax adviser before you choose the town.
Do you need help choosing?
Most people can compare regions on their own with these sources and a scouting trip. It gets harder when the choice depends on a town-specific rule, such as the 7% tax. It also gets harder when housing, healthcare and schools must line up in a small town.
Frequently asked questions
Is it cheaper to live in southern Italy?
Yes, on average. ISTAT puts 2025 household spending at €2,215 a month in the South, against €3,087 in the North-east. idealista's Q3 2026 asking rents run from €18.9 per square meter in Lombardy to €6.9 in Calabria. Exceptions exist: Sardinia averages €14.7 per square meter, and Turin's average rent is below Naples'.
Is healthcare worse in southern Italy?
Regional public-system scores are lower on average in the South. In the Ministry of Health's 2024 assessment, Calabria fell below the pass mark on community care and Sicily on prevention. Puglia, Campania, Sardinia, Basilicata, Abruzzo and Molise passed all 3 areas, and Bolzano in the North fell short on prevention.
Is it easier to find a job in northern Italy?
Yes. ISTAT put the employment rate for ages 15 to 64 at 70.6% in the North in mid-2026. In the South and Islands it was 51.1%. Unemployment was 3.7% in the North and 10.4% in the South.
Is southern Italy warmer than northern Italy?
Yes. ISTAT's 1981 to 2010 averages put the annual mean temperature at 18.9°C in Palermo and 17.2°C in Bari. Milan averaged 14.5°C and Turin 13.9°C. Warmer does not always mean more comfortable: Il Sole 24 Ore's 2026 climate index ranked Carbonia, in Sardinia, last, citing extreme heat and humidity.
Does southern Italy have worse internet?
Not on fiber coverage. At the end of 2025, Sicily had the highest share of households reached by fiber to the home (89%), according to AGCOM. Trentino-Alto Adige and Molise followed. Valle d'Aosta, Calabria and Liguria had the lowest. Check your exact address on AGCOM's Broadband Map.
Where in Italy does the 7% flat tax apply?
In towns of up to 30,000 residents in Sicily, Calabria, Sardinia, Campania, Basilicata, Abruzzo, Molise and Puglia, plus listed earthquake-area towns in central Italy. It applies to people with pension income from abroad who were not tax resident in Italy in the previous 5 years.
Related guides
mySoggiorno
Planning a move, not just a trip?
We handle your move, from legal counsel to your home and arrival, as one engagement. The fit check tells you in about three minutes whether a visa fits your situation.
Check your fit →3 minutes · free · a call if it fitsSources
- ISTAT: La povertà in Italia, anno 2025 (October 15, 2026)
- ISTAT: La povertà in Italia, anno 2025, press release
- ISTAT: Le spese per i consumi delle famiglie, anno 2025
- ISTAT: Il mercato del lavoro, II trimestre 2026
- ISTAT: Ambiente urbano, anno 2024 (September 9, 2026)
- ISTAT: Temperatura e precipitazione dei comuni capoluogo di provincia, anno 2023 e serie storica 2006-2023
- ISTAT: Dati meteoclimatici dei capoluoghi di provincia, tables (XLSX), Table 3: 1981 to 2010 values
- INPS: Osservatorio lavoratori dipendenti del settore privato, i dati 2024 (November 18, 2025)
- Ministry of Health: LEA, summary of the 2024 Nuovo Sistema di Garanzia results (July 10, 2026)
- Ministry of Health: Monitoring of LEA through the CORE indicators, year 2024 (summary PDF)
- Ministry of Health: Rapporto annuale sull'attività di ricovero ospedaliero, dati SDO 2024 (June 2026), via ISS EpiCentro
- ISS EpiCentro: Ricoveri ospedalieri in Italia, il Rapporto SDO 2024
- Normattiva: TUIR (DPR 917/1986), Article 24-ter, text in force April 7 to December 31, 2026
- Normattiva: Legislative Decree 117 of June 19, 2026 (new income tax code), Article 247
- AGCOM: Relazione annuale 2026
- AGCOM: Broadband Map
- RFI: La rete oggi (data at June 30, 2026)
- RFI: La rete oggi, Campania
- RFI: La rete oggi, Puglia
- RFI: La rete oggi, Calabria
- RFI: La rete oggi, Sicilia
- RFI: La rete oggi, Sardegna
- RFI: La rete oggi, Basilicata
- RFI: La rete oggi, Abruzzo
- RFI: La rete oggi, Molise
- RFI: La rete oggi, Lombardia
- RFI: La rete oggi, Emilia-Romagna
- RFI: La rete oggi, Liguria
- idealista: Rents in Q3 2026 (October 1, 2026)
- idealista/data: Average rent by region, Q3 2026 (table)
- idealista/data: Average rent by provincial capital, Q3 2026 (table)
- idealista/data: Average rent by provincial capital, Q3 2026 (full dataset, CSV)
- Il Sole 24 Ore: Qualità della vita 2025
- LaPresse: Qualità della vita 2025 (December 1, 2025)
- Il Sole 24 Ore: Indice del clima (March 9, 2026)
- Sky TG24: Regions ranked on the 2024 LEA monitoring (July 10, 2026)
Rules and office practices change. Every fact in this guide was checked against the sources above on October 24, 2026. This guide is general information, not legal or tax advice.